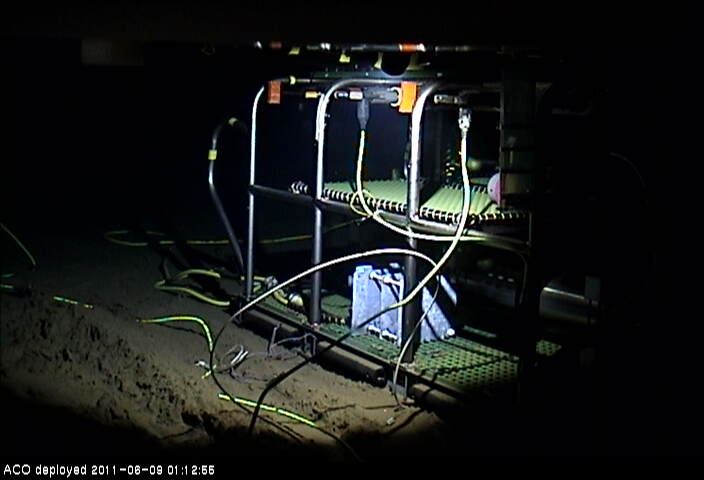
Picture of the ACO taken with the ACO videocamera at 4728m
Real-time Data |
||||||||||||||||||||||||||||||||||||||||||||||||||||||||||
|
|
|||||||||||||||||||||||||||||||||||||||||||||||||||||||||

Latest Real-Time Plots (Data display enabled by SIAM/SSDS provided by MBARI)

Latest Temperature time-series obtained with a Sea-Bird Microcat (SBE-37) SN 2401 located in the Observatory Platform (Small Experiment Module)
[Click on the thumbnail to enlarge the figure]

Latest Salinity time-series obtained with a Sea-Bird Microcat (SBE-37) SN 2401 located in the Observatory Platform (Small Experiment Module)
[Click on the thumbnail to enlarge the figure]

Latest current countours obtained with a 250 kHz SonTek Acoustic Doppler Profiler SN C117 located in the Observatory Platform (Small Experiment Module). The ADP transducers are 1.83 m above the bottom pointing upwards.
[Click on the thumbnail to enlarge the figure]


Pressure time-series obtained with a Paroscientific Inc. (410K-101) SN 90591 located in the Hydrophone Experiment module.
[Click on the thumbnail to enlarge the figure]
"Latest pressure residuals time-series from the Paroscientific Inc. SN 90591, after removing the barotropic tides estimated from the TPXO 7.2 model, and the mean pressure at the observatory (mean pressure from August 1 to 14, 2011).

Picture taken with the Axis 214 PTZ video camera at 1.5 m from
the bottom. The camera is mounted on a tripod and connected to the Observatory.
The lights have failed, no current picture is being displayed.
[Click on the thumbnail to enlarge the picture]
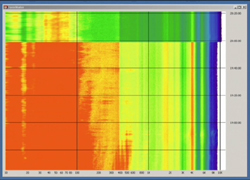
Real Time Streaming Audio
(Requires Real Player)
Includes graphic display of frequency spectral decomposition (increasing frequency to the right), with bright colors showing greater energy. Newest spectra appear at top of image and oldest disappear at the bottom.