ACO Real-time Data Display
| Temperature and Salinity at 4728m | ||||||||||||
9-Apr-2026 10:41:00 UTC |
||||||||||||
| Pressure (dbar) | - |
- |
4823.978 |
|||||||||
| Temperature (°C) | |
1.5049 |
1.5070 |
|||||||||
| Conductivity(S/m) | 0.0000 |
3.1971 |
3.197 |
|||||||||
| Salinity (g/kg) | -0.002 |
34.676 |
34.667 |
|||||||||
| Oxygen (ml/l) | - |
2.796 |
3.359 |
|||||||||
| Current Mean Velocity | ||||||||||||
| Average Doppler currents 34-50 m above the bottom |  ADP1 |
|||||||||||
| East Velocity(m/s) | 0.044 |
|||||||||||
| North Velocity(m/s) | -0.016 |
Absolute Pressure | ||||||||||
| Pressure (dbar) Data is new and provisional |
Fluorometer | |||||||||||
7-Sep-2023 3:52:56 UTC |
||||||||||||
| Chlorophyll (μg/l) | -0.004 |
-0.016 |
||||||||||
| Turbidity (NTU) | -0.074 |
0.018 |
||||||||||


Picture of the ACO taken with the ACO videocamera at 4728m.
The data collected with instruments at the ACO are managed with computers at the AT&T Station at Makaha (see Data Management), transmitted via TCP/IP to computers at the University of Hawaii (see Networking), and displayed here in real-time.
![]() Click here for real-time underwater audio.
Click here for real-time underwater audio.
Daily corrected potential temperatures
 |
 |
|---|
Daily Along-, Cross-isobath mean currents
 |
 |
|---|
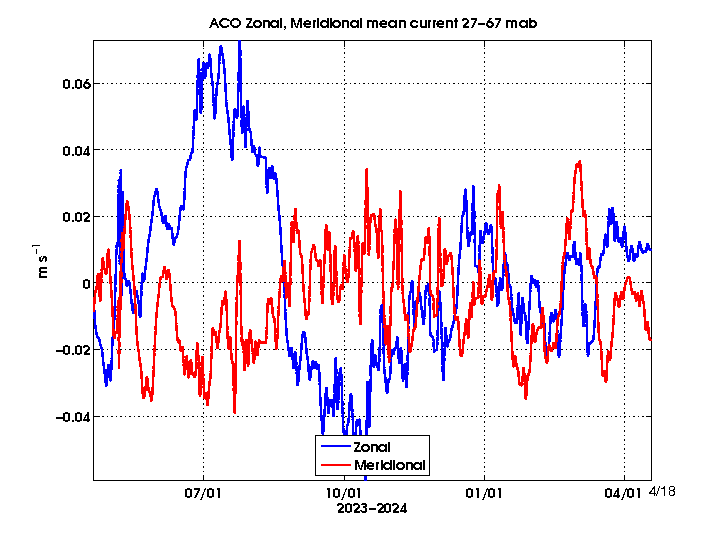
Daily Zonal and Meridional mean Currents
 |
 |
|---|
Latest Temperature time-series obtained with a Sea-Bird Microcat (SBE-37) SN 2401 located in the Observatory Platform (Small Experiment Module)
[Click on the thumbnail to enlarge the figure]
Recent Temperature Plots
Camera 2 failed and is no longer transmitting video and images


Still Image Slideshow Camera 2
Pictures of the abyss are taken every minute with the Axis 214PTZ video camera located at 1.5 m from the bottom, installed in June 2011. The camera is mounted on a tripod and connected to the Observatory.
Still image slideshow(Camera 1 disabled).
Latest Temperatures
Recent Temperature Plots
 |
 |
|---|
 |
|---|
Latest Temperature time-series obtained with CTD1 (left plot: SBE-37 SN 2401), CTD2 (right plot: SBE-37SMP SN 10149), and CTD3 (bottom plot: SBE-53MP SN 005) located in the Observatory platform, Basic Sensor Package, and Basic Sensor Package 2 respectively.
Note: The CTD3 pump was turned off on 9/21/2016 19:47:13 UTC
[Click on the thumbnail to enlarge the figure]
Latest Salinities
Recent Salinity Plots
 |
 |
|---|
 |
|---|
Latest Salinity time-series obtained with CTD1 (left plot: SBE-37 SN2401), CTD2 (right plot: SBE-37SMP SN 10149), and CTD3 (bottom plot: SBE-53MP SN 005) located in the Observatory platform, Basic Sensor Package, and Basic Sensor Package 2 respectively.
Note: The CTD3 pump was turned off on 9/21/2016 19:47:13 UTC
[Click on the thumbnail to enlarge the figure]
Latest Oxygen
Recent Oxygen Plots
 |
|---|

Latest Oxygen time-series obtained with CTD2 (left plot: SBE-37SMP SN 10149) and CTD4 (right plot: SBE-37SMP SN 23203), located in the Basic Sensor Package and Basic Sensor Packages 4 and 5, respectively.
[Click on the thumbnail to enlarge the figure]
Latest Currents
Recent Currents Plots

Latest current countours obtained with a 250 kHz SonTek Acoustic Doppler Profiler SN C117 located in the Observatory Platform (Small Experiment Module).
Latest mean current vector between 34 and 50 m above the bottom, the current magnitude (in m/s) is indicated by the inner circles. East is to the right, up is to the north
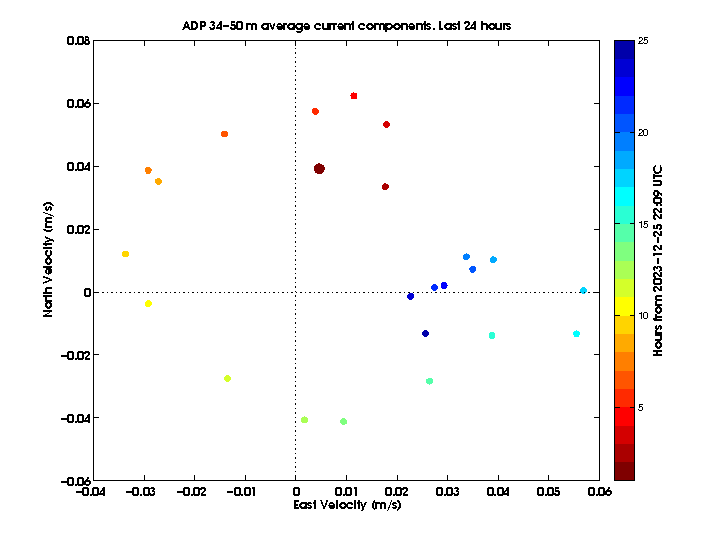
Average current velocity trace in m/s between 34 and 50 m above the bottom for the last 24 hours.
The ADP transducers are 1.83 m above the bottom pointing upwards. The ADP data are processed using software developed by the E. Firing ADCP Laboratory at the University of Hawaii


[Click on the thumbnail to enlarge the figures]
The Paroscientific Nano-BPR pressure data is new and provisional.
Recent Pressure Plots
 |
 |
 |
|---|
| Pressure time-series obtained with Paroscientific Nano-BPR (left) mounted on BSP2, and Paroscientific RBR
(right) mounted on BSP4. |
Latest pressure residuals time-series from the Nano-BPR Pressure Sensor, after removing the barotropic tides estimated from the TPXO 7.2 model, and the mean pressure at the observatory. |
|---|
[Click on the thumbnail to enlarge the figure]
Latest Fluorometer
Recent Fluorometer Plots
 |
 |
|---|
Chlorophyll and Turbidity time-series obtained with the WetLABS Fluorometer (FLNTURTD SN 2027) mounted in BSP2. The red line is a 1-hour running mean.
[Click on the thumbnail to enlarge the figure]

Real Time Streaming Audio with spectrograph
ACO YouTube live spectrograph stream
Real Time Streaming Audio only
Includes graphic display of frequency spectral decomposition (increasing frequency to the right), with bright colors showing greater energy. Newest spectra appear at top of image and oldest disappear at the bottom.
Streaming audio is lossy compressed for broadcast purposes. Please contact Dr. Bruce Howe (bhowe(at)hawaii(dot)edu) to obtain the raw acoustic lossless data for analysis.
Listen to previous sound recordings of whales, earthquakes, etc. obtained with the hydrophone located in the ACO Observatory.
 |
 |
|---|
Latest seismogram time-series obtained with an OAS E-2PD hydrophone located on the JBOX frame of the observatory (Hydrophone Experiment Module). The sensor is nominally 1 m above the bottom. These graphs show low-frequency acoustic signals received by sources such as earthquakes, ships, and baleen whales.
Recent Seismogram Plots
Seismic events previously recorded.
Kilo Nalu Observatory Plots
ADCP-2 and CTD-1 deployed in July 2021 (Data available here)
Recent Currents Plots

Latest current countours obtained with a 1200 kHz TRDI WorkHorse Acoustic Doppler Profiler SN 6934 located in the Kilo Nalu Observatory.
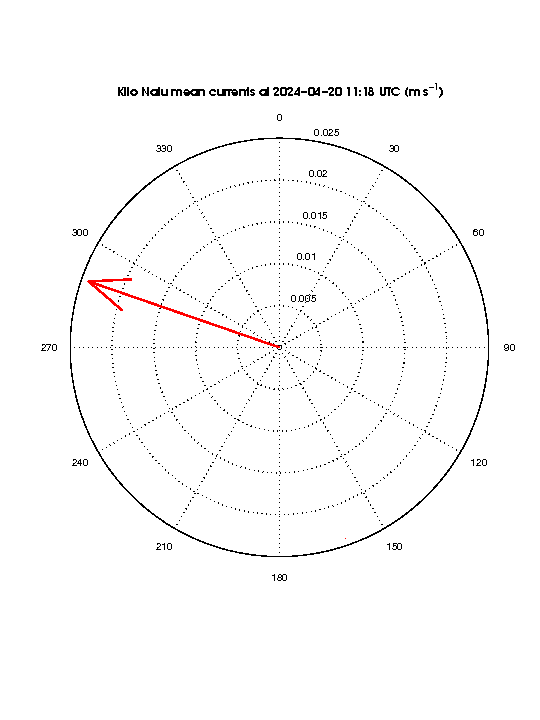
Latest mean current vector between 2 and 15 m above the bottom, the current magnitude (in m/s) is indicated by the inner circles. East is to the right, up is to the north

Average current velocity trace in m/s between 2 and 15 m above the bottom for the last 24 hours.
The ADCP transducers are about 12 m below the surface pointing upwards. The ADCP data are processed using software developed by Geno Pawlak.


[Click on the thumbnail to enlarge the figures]